How to debug Node.js in Visual Studio Code? Node.js debugging VS Code

One thing that never leaves the side of Software Developers is bugs and errors. Trying to fix one bug often leads to another bug. This is a never-ending process. But, there is a way to make this process easier. You can use a debugger to find the bugs in your code. In this article, we will learn how to debug Node.js in Visual Studio Code.
What is a debugger?
Let’s first understand what a debugger is. A debugger is a tool that helps us to run the code in a controlled environment and enables us to track and monitor the code execution. It makes it easier to pinpoint the exact cause of a bug and fix it. Hence it’s called de-bugger.
So far you might have been using only console.log to debug your buggy Node.js app. But today we will see how we can use VS Code to debug any Node.js code.
Start VS Code Debugger for Node.js
Open VS Code and create a .js file. Add some sample code of your choice. If you want to follow along copy and paste the following code.
let count = 0;

function helloWorld() {
  console.log("Hello World!");
}

setInterval(() => {
  count++;
  helloWorld();
  console.log("Codedamn rocks! " + count);
}, 1000);Code language: JavaScript (javascript)
On the VS Code side pane, you will find a “Run and Debug” section. Or you can use the shortcut Ctrl + Shift + D to open the Debug pane.
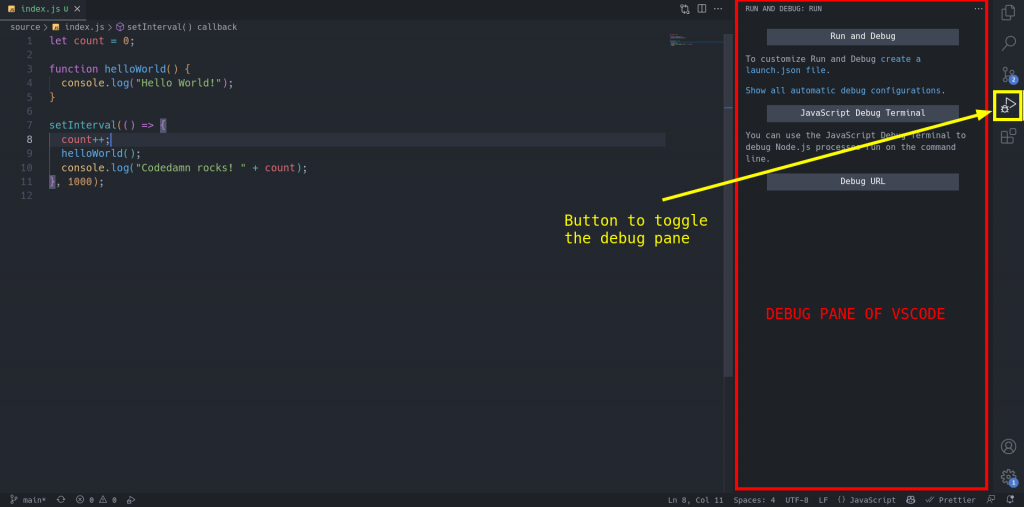
Now click on the “Run and Debug” button. If it asks you to choose the environment, select “Node.js”.
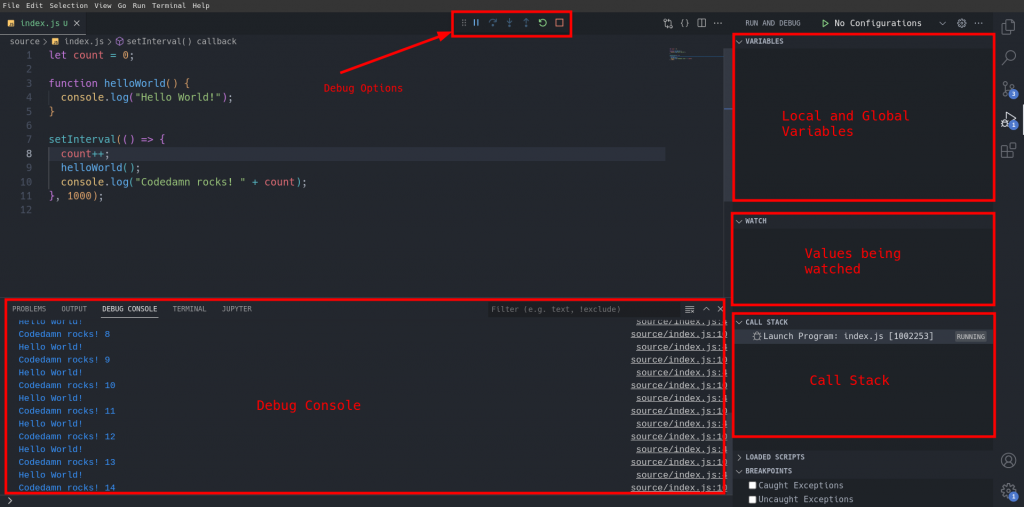
After selecting the environment VS Code will run the node.js script and will attach its debugger to that process. The interface should look something like this:
Before moving forward we need to understand what a breakpoint is.
Understanding Breakpoints
A breakpoint is a point in the code where the debugger will pause the execution of the code. It will allow us to inspect the state of the code at that point. We can also use the debugger to change the values of variables and continue the execution of the code with the updated values.
Creating a breakpoint
To create a breakpoint, hover on the left side beside the line number. You will see a light red dot. Click on it to create a breakpoint. You can also use the shortcut F9 to create a breakpoint on the line your cursor is on currently. It will appear as a red dot beside the line number.
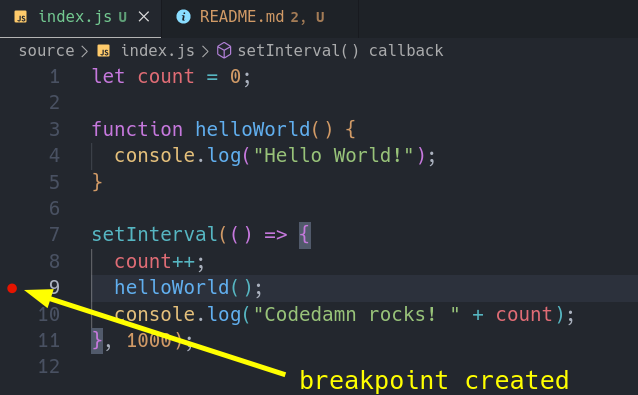
To remove a breakpoint, click on the red dot again or press F9 again.
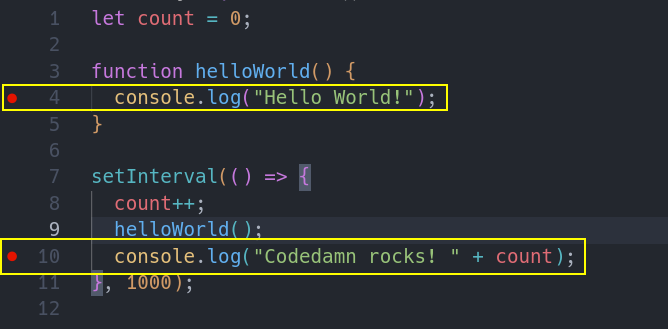
Let’s add two breakpoints on the two console logs in the code.
Let’s start debugging now.
Debugging
Once you press the “Run and Debug” button, the debugger will start running the code. It will pause the execution of the code at the first breakpoint.
It will highlight the line where the execution is paused.
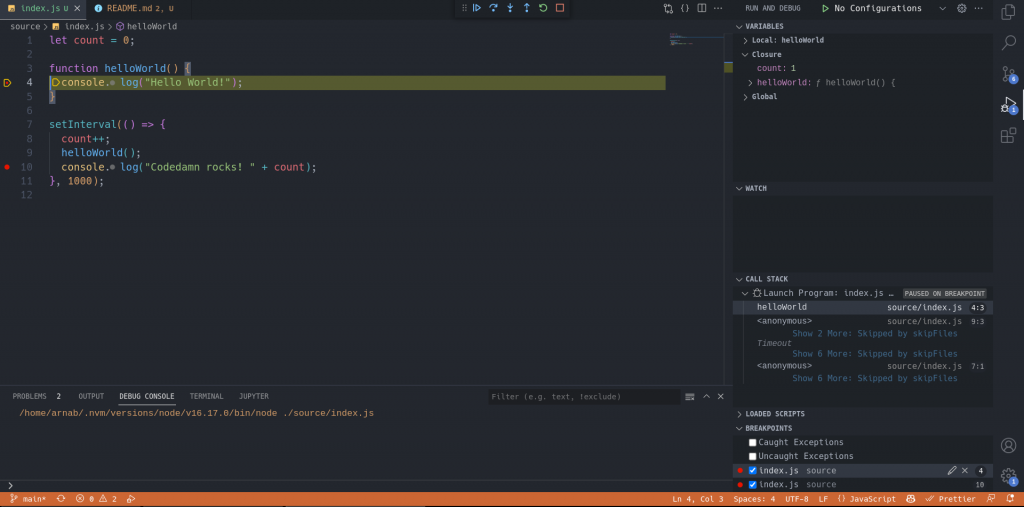
Now, let’s discuss the various sections of the debugger interface.
Debug Console
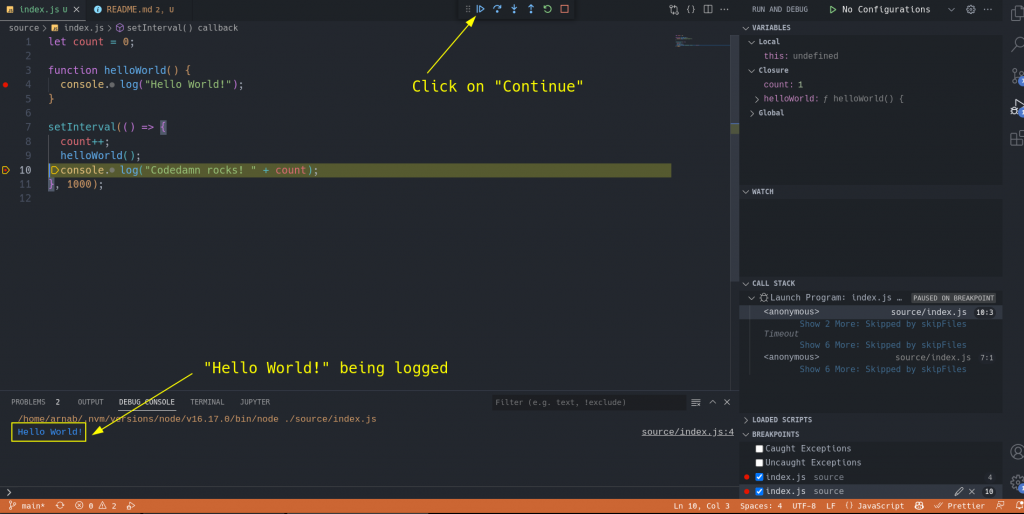
The debug console is the bottom terminal section where you can see the output of the code. It will show the output of the console logs and other statements.
Press the “Continue” button on the debug toolbar. It is the first play button on the toolbar. On pressing you will see a “Hello World!” being logged in the Debug Console.
Variables
On the side pane, the top section is the “Variables” section. It will show the variables and functions that are currently in scope. It will also show the values of the variables.
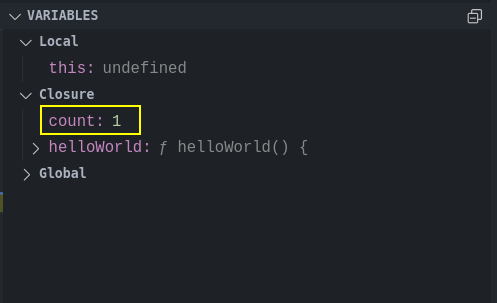
Sometimes, you want to debug your code in a particular scenario. For example, you want to debug the code when the value of the count is 20. To do that, you can change the value of count to 20 in the “Variables” section.
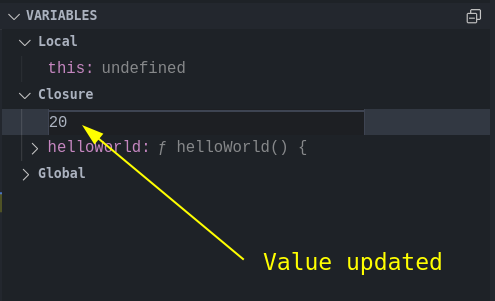
To check if the variable actually got updated, press the “Continue” button once again. You will see that the output in the debug console is now “Codedamn rocks! 20”. This means the variable got updated.
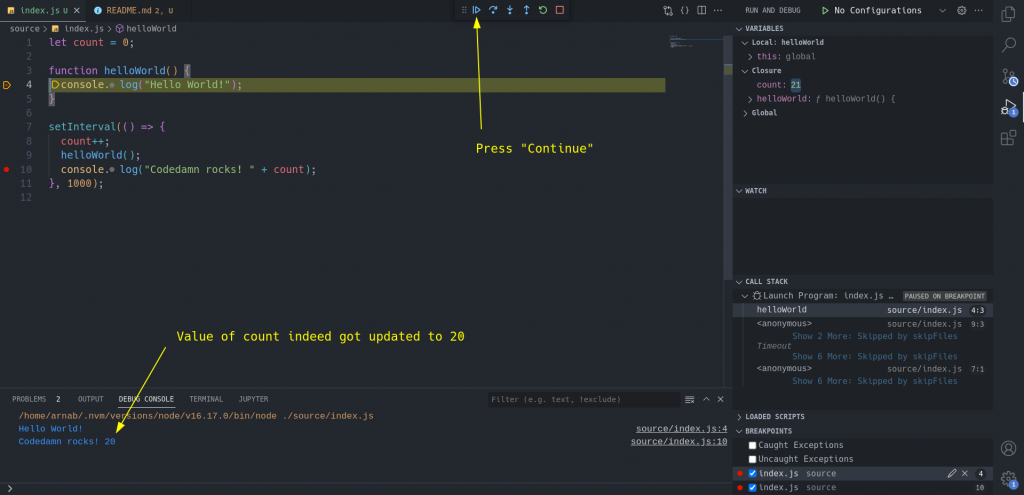
NOTE: You can also check the value of the variable by just hovering over the variable name.
Watch
The “Watch” section is pretty useful when you monitor a particular variable. It will show the value of the variable in real-time. You can add multiple variables to the “Watch” section. This saves you from trying to find the variable in the “Variables” section every time to check its value.
To add a variable to the “Watch” section, click on the “+” icon in the top right corner of the “Watch” section.
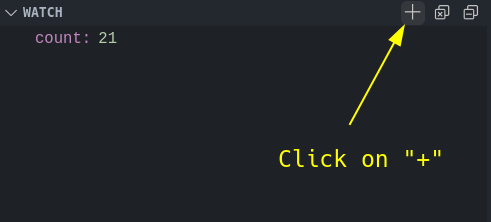
Now, add the variable name count and press enter. You will see the value of the variable in the “Watch” section.
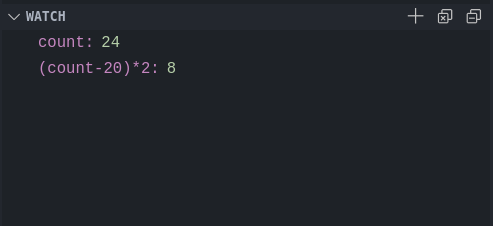
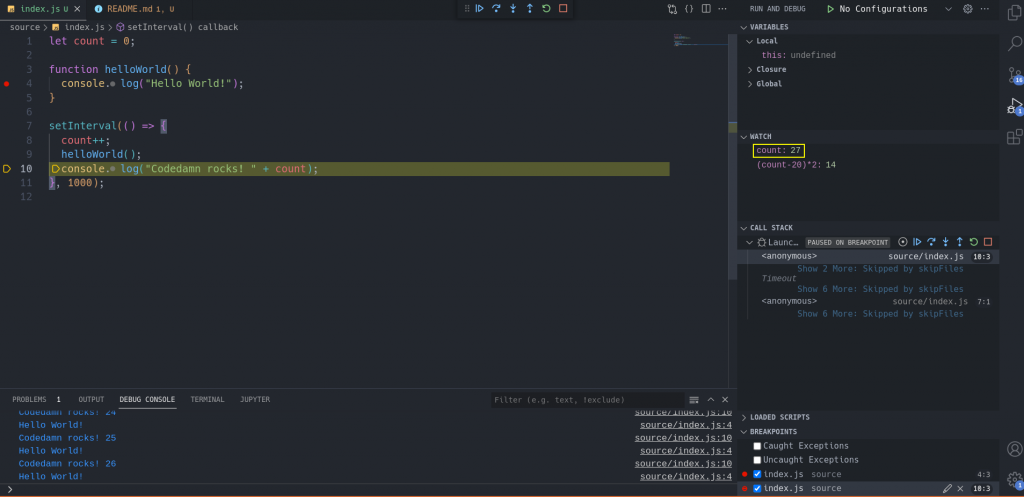
Press the “Continue” button a bunch of times (or you can press F5). You will see the value of the count variable getting updated in real-time.
You can also add expressions like (count-20)*2 to the “Watch” section. It will show the result of the expression.
Call Stack
The “Call Stack” section shows the call stack of the code which will show the functions that are currently in the call stack. This also shows the arguments passed to the function.
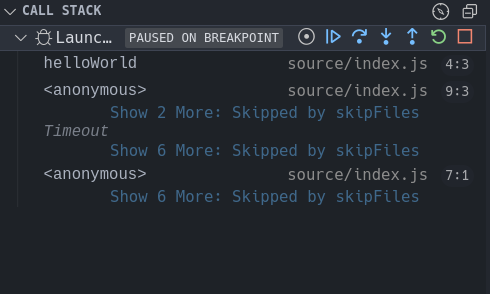
It is pretty useful when the code is running in a recursive manner where it will show the call stack of the recursive function.
Breakpoints
The “Breakpoints” section shows the breakpoints that are currently set in the code. It will also show the number of times the breakpoint has been hit.

We can also:
- disable a breakpoint by clicking on the checkbox on the left side of the breakpoint.
- remove a breakpoint by clicking on the “X” icon on the right side of the breakpoint.
- add a conditional breakpoint by clicking on the pencil icon on the right side of the breakpoint. It will open a dialog box where you can add a condition. The breakpoint will only be hit when the condition is true.
Let’s test the conditional breakpoint. Add a conditional breakpoint on the second console log. Add the condition count === 27. This means it will only be hit when the value count is 27.
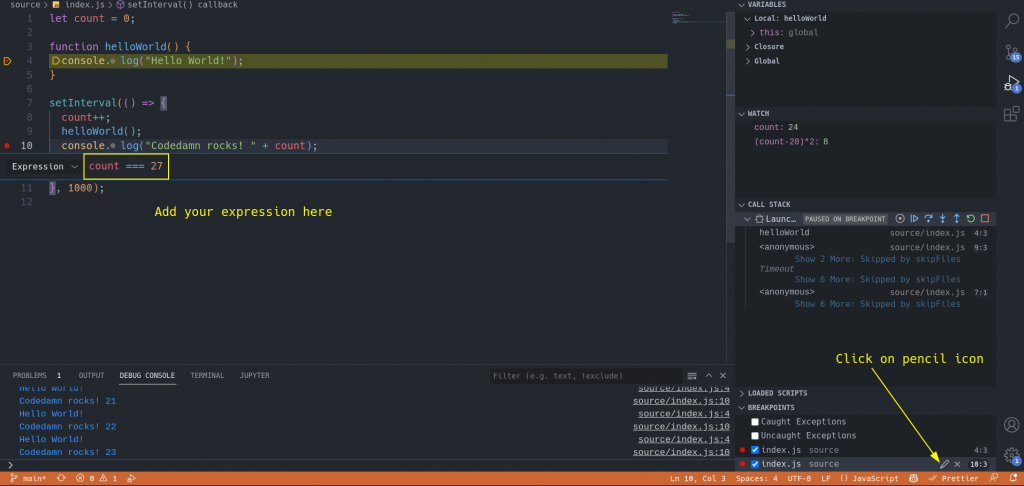
Keep pressing the “Continue” button until the value of the count becomes 27. You will see that the breakpoint is only hit when the value of count is 27.
Debug Toolbar
The debug toolbar is the top section of the debugger interface. It has the following buttons:

- Continue (
F5) – It will continue the execution of the code. It will also pause the execution at the next breakpoint. We have already seen this button in action. - Step Over (
F10) – It will execute the current line of code and will pause the execution at the next line. It will not go inside the function. - Step Into (
F11) – It is similar to the “Step Over” button. But if it hits a function call it will go inside the function and pause on the first line of the function. - Step Out (
Shift + F11) – It will continue the execution till the last line of the current function. Pretty useful when you want to skip the execution of the rest of the function. - Restart (
Ctrl + Shift + F5) – It will restart the debugging process. It will run the code from the beginning. - Stop (
Shift + F5) – It will stop the debugging process.
You can further use these buttons to debug the code more accurately.
Debug a running process
You can also debug a running process. For example, you can debug a running Node.js server. To do that, you need to attach the debugger to the running process.
In our case, first, execute the script by running the following command:
node index.jsCode language: Bash (bash)It will run the code and will start logging the message after every 1 second.
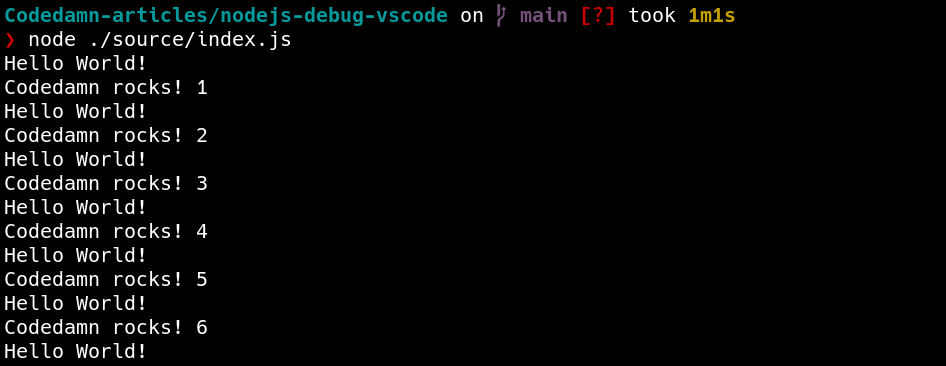
Now, in VS Code press Ctrl + Shift + P and then type “Attach”. Select the “Debug: Attach to Node Process” option.
It will show a list of running Node.js processes. Select the process that is running the index.js file.
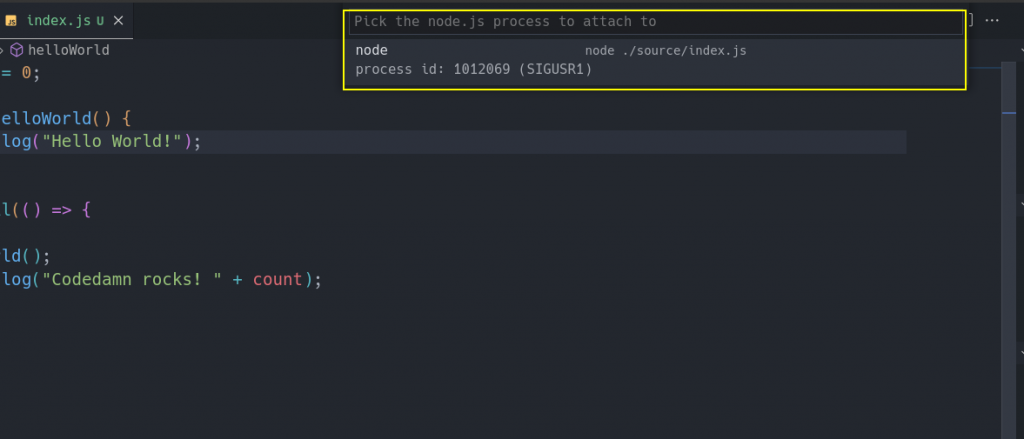
You will see that the debugger is now attached to the running process. It will pause the execution of the code at the first breakpoint.
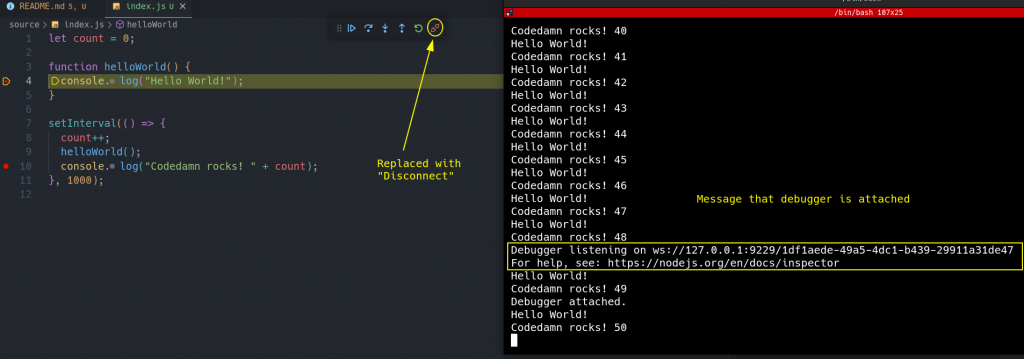
Few things to note:
- The Terminal will show that the debugger is attached to the process.
- The Stop symbol is now replaced with a “Disconnect” symbol. Pressing that will disconnect the debugger from the process.
This is pretty useful when you already have a web server running and you want to debug it. In that case, you can just use VS Code to attach the debugger to the running process.
You can further configure your Debugging experience by adding launch configurations. You can read more about it in the official documentation.
Conclusion
In this article, we learned how to debug node.js code using VS Code. We learned about breakpoints, variables, watch, call stack, and the debug toolbar. We also learned about conditional breakpoints and how to use them. Finally, we learned how to debug a running process.
I hope you enjoyed this article. You can also follow me on Twitter at @ArnabSen1729.
Sharing is caring
Did you like what Arnab Sen wrote? Thank them for their work by sharing it on social media.
No comments so far
Curious about this topic? Continue your journey with these coding courses:

